For municipalities, inter-municipal bodies and local authorities
People call the town hall. It's the prefect who decides.
In between, data is missing. Odour.Live collects your residents' reports, qualifies them according to the frameworks used by environmental agencies, and gives you indicators you can present to the municipal council as well as to the prefecture.
Free. No extra work for your staff. Independent of the operator.
Free
No licence, no subscription, no budget line to create.
Frees up your staff
Reports arrive structured, without going through the switchboard or a staff member who writes them down.
Reliable data
A single form for everyone: no more inconsistency between phone calls, e-mails, the website and the town's app.
Several sites, one method
As many installations as needed, each with its own indicators, in a single space.
Neutrality preserved
The municipality provides a channel and publishes what comes out of it. It documents, it does not accuse.
The problem
Residents' first point of contact, with no authority over the installation.
When it smells, nobody calls the prefecture: they call the town hall. Your staff take the calls, pass them on, and have neither the means to prove anything nor anything to answer with. Meanwhile, the operator claims it has received no complaints and residents conclude that the municipality is doing nothing.
What you experience today
With odour.live
You cannot decide in the prefect's place. You can make the decision hard to postpone.
Efficiency
From a resident's report to an item at the municipal council
Five steps, automated from start to finish. No data entry, no reprocessing, no formatting for your services to do.
Collectwithout going through your services
Residents describe the odour they perceive in a few taps. The time, position and weather conditions at that moment (wind direction and strength, gusts, temperature) are recorded automatically. No account, no cookie, no personal data.
The switchboard stops being the entry point. The report exists at eleven o'clock on a Sunday night, with nobody on the line.
Integrate what existsfile import
Reports already collected elsewhere (the town's app, the municipal website form, a complaints register, the technical services' spreadsheet) are imported and join the same framework.
Your years of archives stop being dead stock: they become demonstrable history.
Qualifyinstant
Each report is structured according to the FIDOL factors, VDI 3882 intensity, an odour typology, time-stamping, location and weather. It becomes comparable data, whatever its origin.
A call to the switchboard and an online report can be added together.
Aggregate and monitorreal time
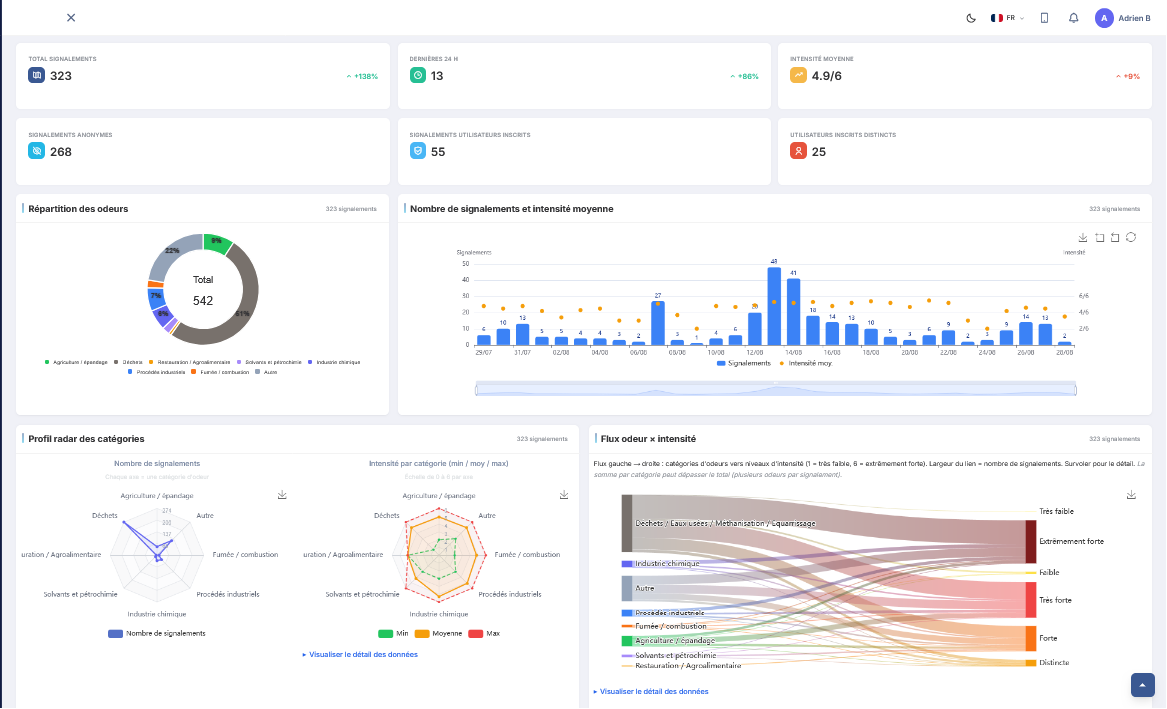
Cross-analyses by hour, by day, by sector, by odour type, by wind direction, by site. The thresholds you set trigger an alert as soon as they are exceeded.
You are informed during the episode, not when residents complain about it.
Report1 click
Report in PDF, DOC or PowerPoint format, anonymised spreadsheet export, maps and charts. For the municipal council, the site monitoring committee, a letter to the operator, a referral to the prefecture or a publication for residents.
The same dataset serves both public debate and the administrative file. No one can accuse you of having two versions.
Territory
A wastewater treatment plant, a composting platform, an industrial site. One single system.
In any area, sources are rarely unique, and that is precisely what makes the issue so hard to resolve. Each operator points to its neighbour, each resident has their own conviction. A single method applied to all sites finally makes it possible to compare what is comparable.
Each activity has its signature
Anaerobic digestion, livestock farming, waste and composting, food processing, sanitation, rendering: odour types differ, and that is what makes it possible to tell them apart.
Inter-municipal scale
An inter-municipal body can cover several municipalities, each keeping access to the data that concerns it.
Telling sources apart
Cross-analysing typology, wind direction and time of day makes it possible to distinguish two neighbouring sources. That is the question everyone asks you.
Visibility follows the area, not the status
A municipality sees all the reports in its area. A residents' committee with the same area sees exactly the same ones. When set up around an installation, such a committee can define a radius and see reports from several municipalities.
No one has privileged access because of who they are, neither the local authority because it is the authority, nor an operator if it pays for the tool. It is the declared area that determines what one sees, and this rule applies to everyone.
Continuity
You already have data. It is not lost.
Most municipalities already collect reports, one way or another. Nothing that has been gathered needs to be thrown away, and past records are often the most valuable argument in a case file.
Import your files
From the town's reporting app, a municipal form, the technical services' spreadsheet or a complaints register.
Bring in your history
Complaints received in recent years can be reintegrated, even if only partly qualified. Incomplete but dated data is still data.
Channels that coexist
Your municipal app can keep running: it feeds the platform instead of competing with it.
Permanent export
Your data can be exported in an open format at any time, including after the end of the agreement. No lock-in.
Responsiveness
Be alerted during the episode, not after.
You set your own thresholds: number of reports within a time slot, average intensity, geographical concentration. Exceeding a threshold triggers an immediate alert.
Thresholds you configure
By odour type, by period, by intensity level. Adapted to your area, not to a generic model.
Immediate alert
To the elected official on duty, the technical service or the on-call team, depending on your organisation.
Act during the episode
Calling the operator while it still smells makes it possible to link the nuisance to a specific operation. The next day is too late.
Traceability of your response
Residents are informed that the local authority receives the reports. They feel heard and reassured, and you can show that the municipality is taking action.
Reporting
Everything you need for a municipal council item in five minutes.
The same figures for the council, for residents, for the operator and for the prefecture. A single version of the facts, always available.
Volume and trend
Number of reports over the period, change compared with the previous one, number of distinct contributors.
Severity
Distribution of intensities on the VDI 3882 scale, share of reports above “strong”.
Exposure
Number of episodes identified, cumulative declared duration, most affected sectors.
Probable origin
Breakdown by odour family and wind direction, allowing a site-by-site analysis.
Effect of measures
Comparison before and after a commitment made by an operator. That is what turns a promise into an obligation to deliver results.
These analyses are produced automatically and are recalculated with every new report.
Wind rose
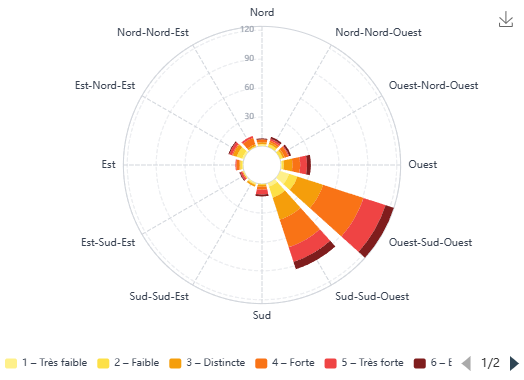
Wind rose and weather conditions
Weather conditions are recorded with each report, not reconstructed afterwards.
The hardest argument to challenge: reports are concentrated when the wind blows from the site.
Time cross-analysis
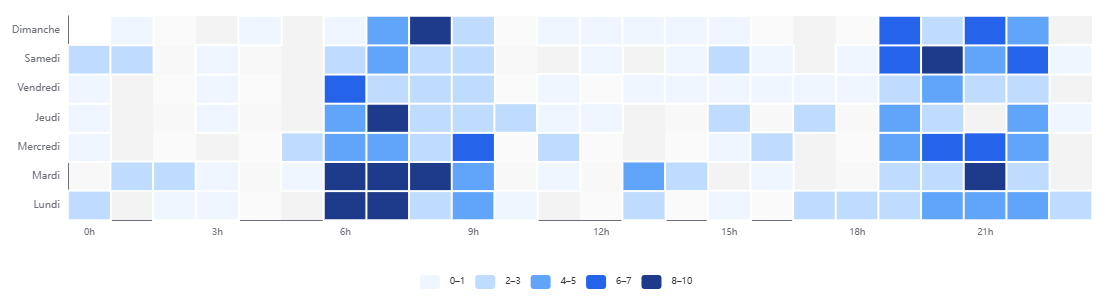
Hours, days, months
Reports displayed by hour, day of the week or month.
Episodes follow the operating rhythm, not chance.
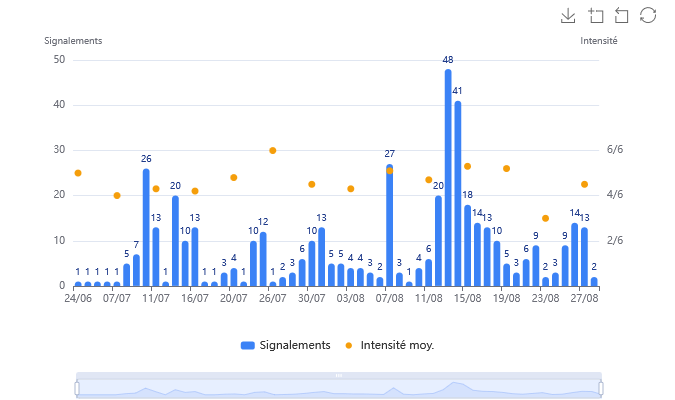
Time series
Trend and average intensity
Number of reports and average intensity, hour by hour, day by day or month by month.
“Is the situation really improving?”: the question asked at every council meeting.
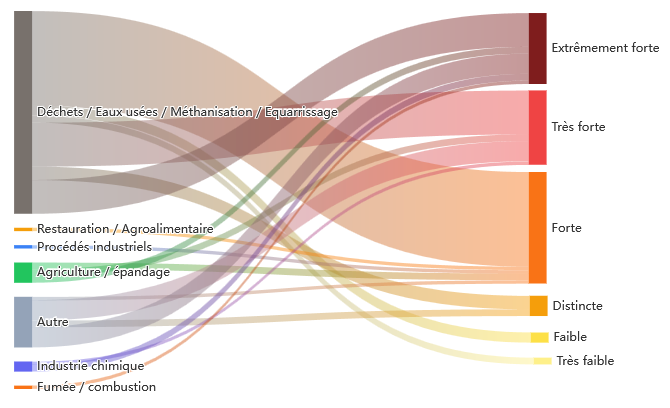
Typology
Odour typology and intensity
Share of each odour type in the reports, with details by type and sub-type available.
A dominant odour signature, pointing to a specific process.
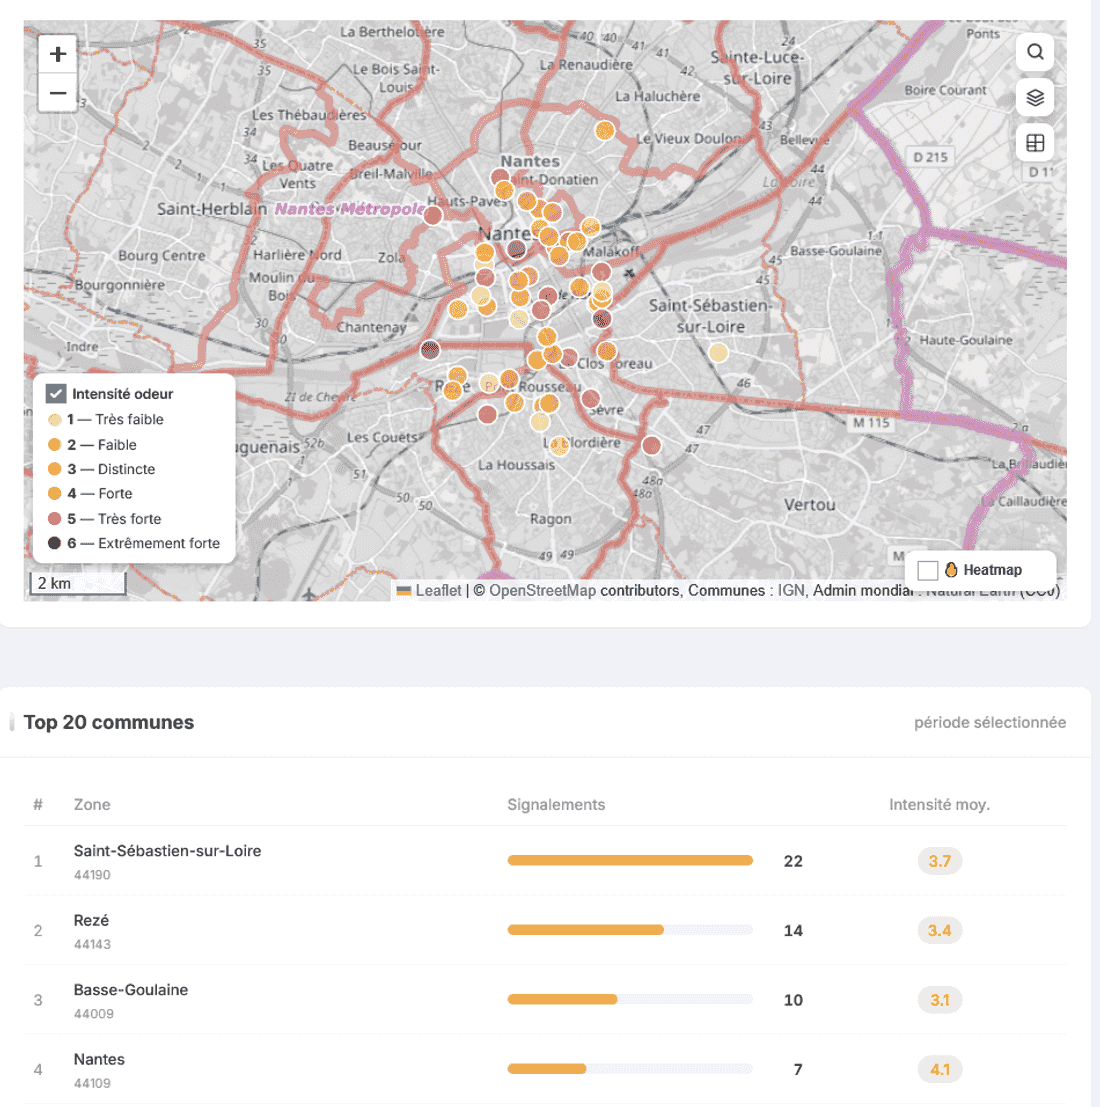
Sector map
Map of exposed sectors
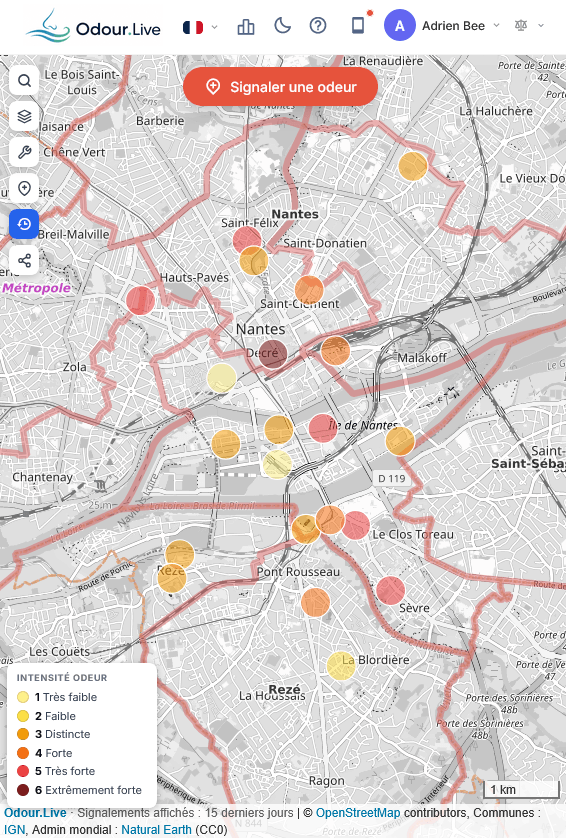
Overview of the area with intensity per point and the top 20 most affected zones, ranked by number of reports.
Which streets, which neighbourhoods, which facilities. The visual that speaks to an elected official.
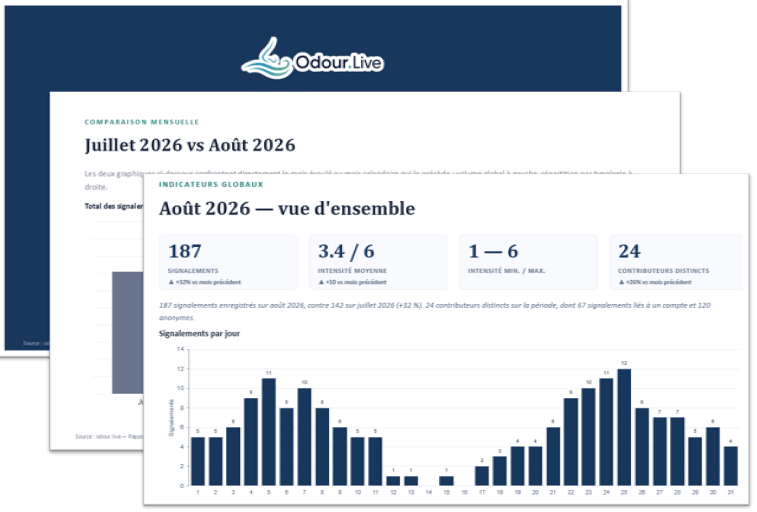
Report
An automatic PowerPoint report
Cover page, overall indicators and monthly comparison generated automatically, ready to attach.
Ready to attach to a council resolution or a letter to the prefecture.
Many other analyses are available on the platform: analysis of comments and free-text fields, word cloud, average daily profile, correlation with temperature, daily trend by odour type.
A municipal council runs on figures or on impressions. You choose which.
Reliability
A method you will not have to defend.
The frameworks used are those of environmental agencies and odour standardisation. That is what allows a local authority to produce figures without being suspected of having built them for the occasion.
FIDOL factors
Frequency, intensity, duration, offensiveness, location. The grid used by environmental authorities to qualify an odour nuisance.
VDI 3882 scales
Intensity and hedonic tone on standardised scales: your year-on-year comparisons hold up.
Weather recorded at source
Wind, gusts and temperature at the time of the report. Not reconstructed afterwards, so hard to challenge.
No file of complainants
Anonymous reports, degraded position, no cookies. You get the information without creating a sensitive data processing operation.
The methodology in detail
The frameworks, sources and acknowledged limits of the platform are set out there in detail. It is the page your contacts will consult to check (and the one you can cite in a letter).
Position
Documenting is not accusing.
A municipality rarely lives without the company that keeps it alive. The obstacle is almost never technical: it is the fear of appearing to take sides. A neutral collection system, applied in the same way to all sites, allows exactly the opposite: being useful to residents without siding against an employer.
Neither judge nor party
The municipality makes no judgement: it provides a channel and publishes what comes out of it. The data speaks for it.
Independent of the operator
No operator, no local authority and no third party can delete, modify, hide or delay a report. Only its author, if they have an account, can request its withdrawal.
Useful to the operator too
Time-stamped and georeferenced reports allow it to target its actions. Many prefer usable data to a rumour.
Information symmetry
Residents, elected officials, the operator and government services see the same figures at the same time. Visibility follows the area, never the status or the financial contribution.
Our business model, frankly
Operators can access the platform, and that access may be charged to them. It is charged to them; it is never charged to a local authority, an association, a journalist or a resident. What an operator buys is the tool: visualisation, alerts, analysis. It buys no information that you don't already have.
It sees neither more data, nor more precise data, nor sooner than you. Any feature opened to an operator in your area is open to you free of charge. And paying gives no rights over the content: it cannot delete, modify, hide or delay a report, nor challenge it before publication.
What the local authority produces and shares, reports, maps, indicators, is free to use, including towards the operator, the prefect, the press and residents; only the transfer of the raw dataset to a third party for reuse is regulated.
Reports are kept for five years, then archived in anonymised and aggregated form with no time limit. A before-and-after comparison around the commissioning of an installation therefore remains possible beyond five years.
The municipality does not say who is wrong. It says what its residents perceive, when, where, and how strongly.
Levers
Five uses where data changes the outcome
General information about French law, not legal advice.
Get started
Your space on the platform up and running before the next council meeting.
Declare your area and your sites15 minutes
Municipality or inter-municipal body, area, installations to monitor, alert thresholds and recipients. Free, approval within 24 to 48 hours.
Import your historyoptional
Complaints and reports already collected join the platform. Your past records become immediately usable.
Inform your residentskit provided
Insert for the municipal newsletter, poster with a QR code, social media post, banner for the town's website, message for the electronic information board.
No budget, no delay
The service is free: no budget line to create, no renewal to plan for. A deputy mayor or a head of department can launch the system without waiting for the next budget cycle.