For residents' committees, associations and community groups
Your residents report. You prove it.
Odour.Live centralises your residents' reports, qualifies them according to the frameworks used by environmental agencies, and gives you analyses and reports ready to send to the operator, the town hall and the environmental authorities (in France, the DREAL).
Free. No consultant. No middleman.
Free
No licence, no subscription, no quote. For committees, associations, local authorities and journalists.
Zero data entry
No more e-mails to sort, forms to copy out or spreadsheets to update on Sunday evenings.
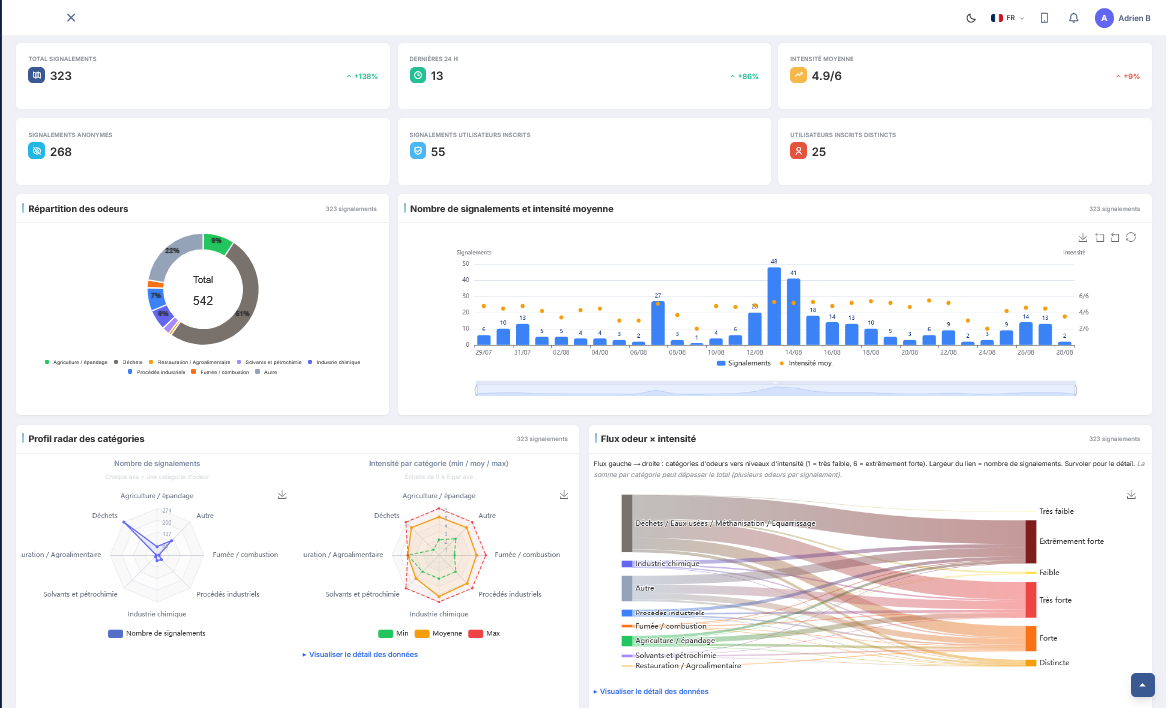
Real-time analyses
Each report appears immediately and updates your statistics and exportable reports (PDF, XLSX).
Tamper-proof data
No operator, no local authority and no third party can delete, modify, hide or delay a report. Only its author, if they have an account, can request its withdrawal.
International standards
FIDOL, VDI 3882, standardised odour typology, time-stamping and georeferencing.
The problem
A spreadsheet is not a case file.
Most groups already collect reports: by e-mail, by messaging app, by online form. The problem is not getting residents involved: it's what is left of it when you need to convince.
What you do today
With Odour.Live
The same effort asked of residents. A result that stands up in front of an inspector.
Efficiency
From the nuisance felt to a document that becomes the reference
Four fully automated steps. Nothing to enter, nothing to reprocess, nothing to format.
Collect< 1 min per report
The resident opens the group's link and describes the odour in a few taps: intensity, type, duration, nuisance felt. The time, position and weather conditions at that moment are recorded automatically: wind direction and strength, gusts, temperature. No mandatory account, no cookie, no personal data required.
No report gets lost any more, and none depends on your availability.
Qualifyinstant
Each report is structured according to the five FIDOL factors, intensity on the VDI 3882 scale, a typology based on odour wheels, time-stamping and location. It stops being a testimony: it becomes comparable data.
Two reports from two different people can be added together.
Aggregatereal time
Reports are cross-referenced: by hour, by day, by geographical sector, by odour type, by wind direction. Recurrences appear, episodes take shape, the most exposed areas stand out on the map.
You go from “people are complaining” to “214 reports, 68% of them between 8 pm and midnight, concentrated to the north-east of the site, with a south-westerly wind”.
Report1 click
A full PDF report for the period of your choice, anonymised CSV / XLSX export, exportable maps and charts. Ready to attach to a letter, a formal complaint, a site monitoring committee or a press file.
Your case is ready before the meeting, not three weeks after.
Independence
Your data depends on no one.
An odour monitoring scheme is rarely neutral: it is frequently funded, framed or operated by the party being questioned, or by a body it belongs to. This is not a question of competence: it is a question of position. On Odour.Live, collection, analysis and reporting belong to the group that produces them.
Your data is never negotiable
No operator, no local authority and no third party can delete, modify, hide or delay a report. Only its author, if they have an account, can request its withdrawal — no paid option will ever allow otherwise.
No dependence on a consultancy
The analyses usually invoiced are built in and permanent.
No gatekeeper
View, export and publish your data freely: reports, maps, indicators, including to the operator, the prefect, the press and your members. Only transferring the raw dataset to a third party for reuse requires our agreement.
No black box
The frameworks used and the calculation methods are explicit and documented on the Method page.
Our business model, frankly
Operators can access the platform, and that access may be charged to them. It is charged to them; it is never charged to a group, an association, a local authority, a journalist or a resident. What an operator buys is the tool: visualisation, alerts, analysis. It buys no information that you don't already have.
It sees neither more data, nor more precise data, nor sooner than you. Any feature opened to an operator in your area is open to you free of charge. And paying gives no rights over the content: it cannot delete, modify, hide or delay a report, nor challenge it before publication.
What your group produces and shares, reports, maps, indicators, is free to use, including towards the operator, the prefecture, the press and residents; only the transfer of the raw dataset to a third party for reuse is regulated.
The aim of the platform is to better equip citizens and make them independent of the operator: a single, shared and transparent source of truth.
Air quality monitoring associations (AASQA in France), laboratories and consultancies keep their full role: standardised measurements, olfactometry, dispersion studies. Odour.Live documents something else: what residents actually perceive, continuously and over time, which no one-off campaign can capture. The two approaches complement each other.
Method
Each report is built as data, not as a complaint.
The frameworks used are those of environmental agencies and odour standardisation. That is what makes the difference between a file of grievances and a defensible case.
FIDOL factors
Frequency, intensity, duration, offensiveness, location. The grid used by environmental authorities to qualify an odour nuisance.
VDI 3882 scales
Intensity and hedonic tone on standardised scales: your year-on-year comparisons hold up.
Weather recorded at source
Wind, gusts and temperature at the time of the report. Not reconstructed afterwards, so hard to challenge.
No file of complainants
Anonymous reports, degraded position, no cookies. You get the information without creating a sensitive data processing operation.
The details, on a separate page.
The detailed frameworks, sources, scales and acknowledged limits of the platform are set out there in full. It is also the page your contacts will consult to check.
Read the full methodAnalyses
The analyses you are usually charged for. Included.
They are recalculated with every new report.
Nothing to order, nothing to wait for, nothing to pay.
Here are a few examples: many other charts are available and directly accessible on the platform.
Wind rose
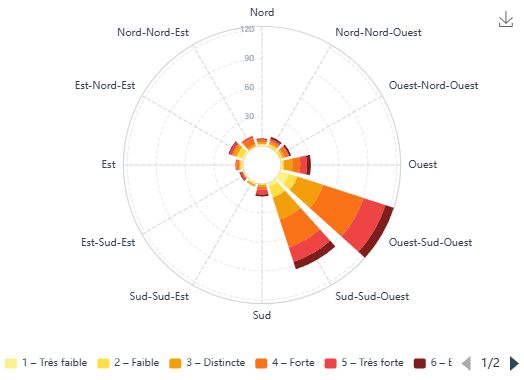
Wind rose and weather conditions
Weather conditions are recorded with each report, not reconstructed afterwards. This allows correlation with the wind (direction, strength), temperature, humidity, ...
The hardest argument to challenge: reports are concentrated when the wind blows from the site.
Time cross-analysis
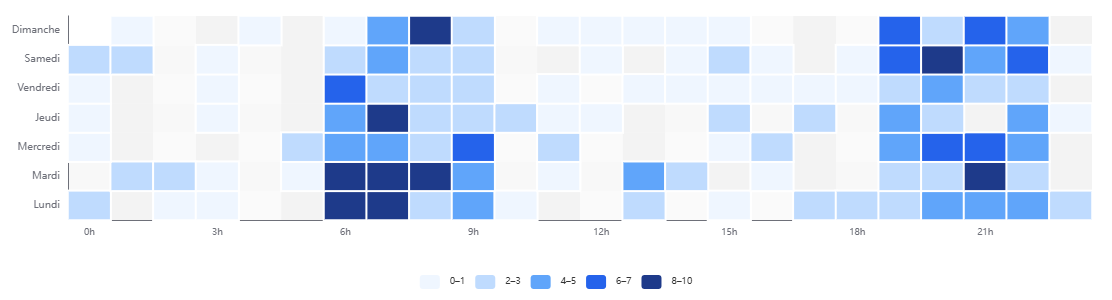
Time cross-analysis of reports
Reports (number, intensity) displayed by hour, day of the week or month: a way to better identify cycles and probable causes.
Odours do not occur at random: they follow the rhythm of operations.
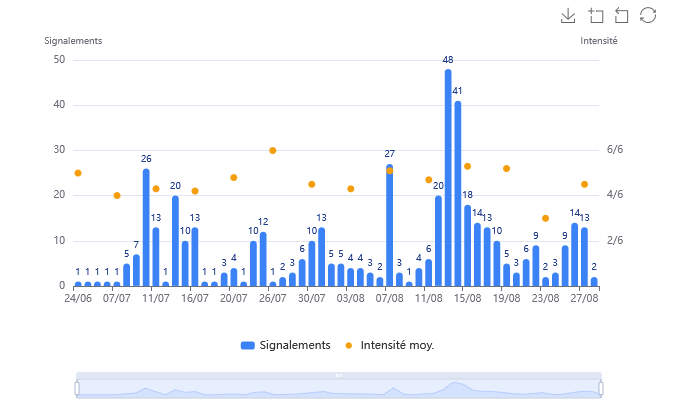
Time series
Trend and average intensity
Number of reports and average intensity, hour by hour, day by day or month by month...
How long the phenomenon lasts, and the real effect of announced measures.
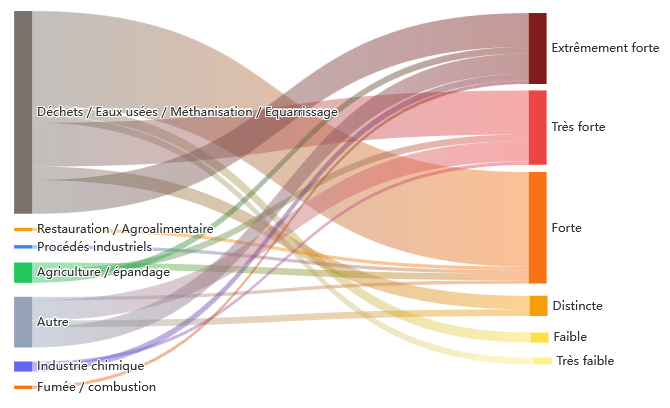
Typology
Odour typology and intensity
Share of each odour type in the reports, with details by type and sub-type available.
A dominant odour signature, pointing to a specific process.
Many other analyses are available on the platform: analysis of comments and free-text fields, word cloud, average daily profile, correlation with temperature, daily trend by odour type, ...
A consultancy charges several thousand euros for this level of analysis and delivers it once. Here, it updates itself.
Real time
You see what is happening while it happens.
A live dashboard
Each report appears immediately on the map and in the statistics.
Episodes spotted on the spot
When reports pile up over a few hours, the episode is visible straight away.
Responsiveness
Alert the operator, the town hall or the inspectorate during the episode, not three weeks later.
Permanent visibility for your members
They see their reports count. That is where trust in the group is built.
Reporting
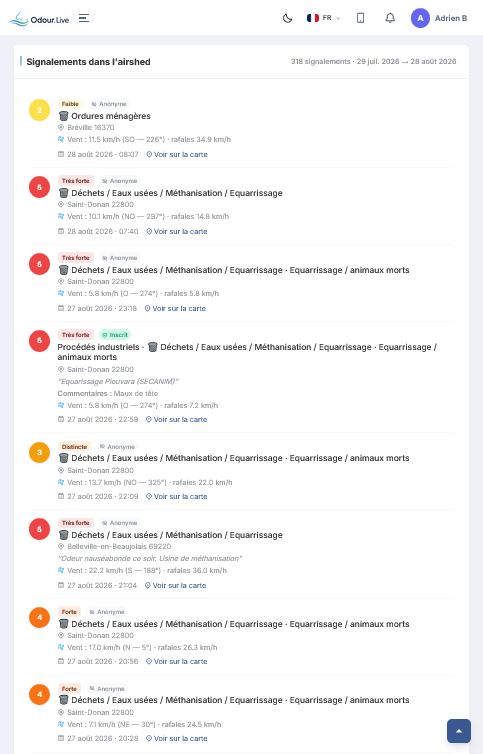
A case file ready to send, in one click.

A case file that can be verified is a case file that is hard to dismiss.
Reports are kept for five years, then archived in anonymised and aggregated form, with no time limit: your historical series remain comparable.
Uses
What is it for, in practice?
Environmental authorities, prefecture
Attach a dated, located and methodologically sound history to a formal complaint. Document frequency, intensity and duration to support a request for an inspection, an additional order or a dispersion study.
Town hall, elected officials, site monitoring committee
Give the mayor concrete evidence to exercise his or her police powers or refer the matter to the prefecture. Arrive at the site monitoring committee with figures, maps and a method, not with impressions.
Operator
Provide time-stamped and georeferenced reports that make it possible to link a nuisance to a specific operation: loading, turning, maintenance, an air treatment shutdown. An operator acting in good faith has no better tool to target its actions.
Reporting is not accusing: it is providing the information that makes it possible to fix things.
Get started
Up and running in two days.
Create your group's space5 minutes
Group name, area concerned, site or installation monitored. Free, approval within 24 to 48 hours.
Share the link or a QR code for quick reportingkit provided
Share the reporting link in your Facebook and WhatsApp groups, by e-mail, ... Poster to print, visual for social media, ready-to-send message, insert for your newsletter. View and download the print-ready visuals to leave with the shops in your neighbourhood.
Let the history build up
View your analyses whenever you like, export when you need to: public meeting, letter, site monitoring committee, formal complaint.
How many reports are needed?
There is no regulatory threshold. What carries weight is regularity and repetition over time: a few dozen residents who report systematically, for months, are worth far more than hundreds of reports concentrated in a single week of mobilisation.