For operators of classified installations
Know where it comes from, act fast, and let people know.
Odour.Live collects odour reports from around your site, qualified against the reference frameworks of environmental agencies and time-stamped with wind conditions. Cross-checked with your operating conditions, they show which operation, at what time, under which wind: in other words, where to act first.
And what you commit to is visible: announced works, measures taken, measured effects, available to everyone at the same time.
Target your actions
Which operation, which hour, which wind pattern. Act where it matters rather than everywhere at once.
Step in during the episode
Your on-call team is alerted while it smells, not when the letter arrives.
Show what you commit to
Works, technical shutdowns, ongoing investments: announced, dated, visible to all.
Measure the effect of your investments
Before and after a treatment measure: the indicator missing from every investment case.
Keep your register without thinking about it
Fed continuously, with the follow-up given to each entry, ready to export the day it is requested.
Operator space
The operator dashboard
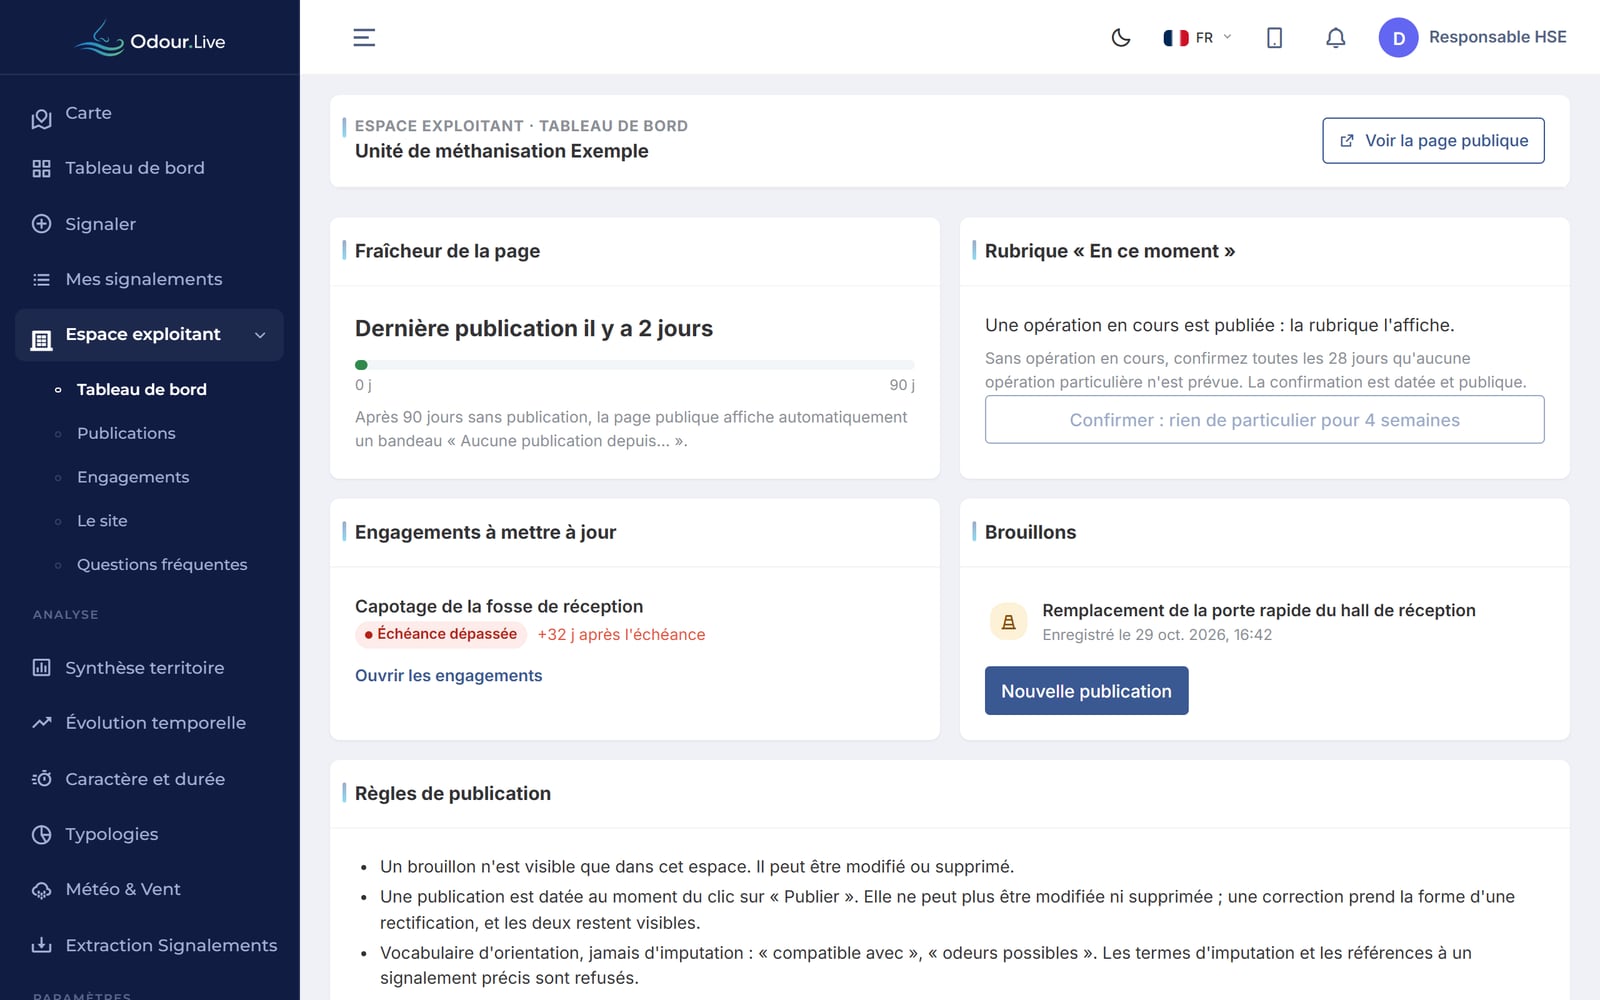
Freshness of the public page, commitments to update, drafts and publication rules: whatever needs action comes first.
A page kept up to date in a few minutes a week.
Transparency is what restores the relationship.
A neighbourhood that knows where odours come from, what is being done to reduce them and how much that costs does not react the same way as one left in silence. Making sources, activities, incidents and investments visible defuses most situations before they become crises. Those that erupt anyway find, on the other side, a clear history and factual data — not a denial that could be challenged or debated.
The situation
You want to deal with the problem. You are rarely given what you need to locate it.
A complaint passed on three weeks later, with no precise time or place, allows no action. You then take broad and costly measures without knowing whether they target the right source, and without being able to show that they had an effect. It is not a matter of goodwill: it is a matter of information.
What you deal with today
With Odour.Live
You cannot fix what you cannot locate. And what is not seen does not exist for the neighbourhood.
What it really takes
Half a day to start, two minutes a day, one hour a month.
It is the first question of any environmental manager, and it deserves an answer before any list of features.
Reports come inwithout you
Residents report free of charge, without an account. Time, approximate position, odour family, intensity, perceived duration, and weather conditions recorded automatically. You have nothing to install and no role in the collection.
It is because you do not touch it that the data carries weight, including when you present it in committee.
You describe your site oncehalf a day, assisted
Located sources, nature, operating pattern, associated treatment, and the link between each source and the odour families of the reference framework. That link makes everything else possible.
Work done once, then reused in every analysis and every report.
You declare your operations2 minutes a day, or none
Three levels to choose from, detailed below: a typical week entered once and for all, a file import from your own tools, or one-off declaration of an event. The first level requires no daily input.
You start at the lightest level and only add precision where an episode justifies it.
Matching happens on its owncontinuously
Each episode is matched with the wind, the distance, the odour family and what was running at the time. Recurring patterns appear, risk periods take shape.
“61% of high-intensity reports occur during operations in the east sector, with a north-westerly wind”: a sentence you can base a decision on.
You decide, publish and measure1 hour a month
The monthly review always asks the same questions, records the measure decided with its deadline, and produces the report. What you commit to can be announced to the neighbourhood, and its effect is then read on the same curve everyone consults.
The approach builds up continuously instead of being reconstructed when someone asks for it.
Site profile
A report only becomes actionable once it is related to a source.
“Sulphur smell to the north-east at 9.40 pm” points to nothing as long as the platform does not know what you have to the north-east and what, on your site, can smell of sulphur. The site profile is the initial work that turns a list of reports into a diagnosis.
Located sources
Each emission source identified on the site, with its nature, height and operating pattern.
Link to odour families
Each source linked to the families of the framework used by residents: the key to reading everything else.
Treatment systems
Scrubber, biofilter, enclosure, cover: what is in service, and what is not on a given day.
Regulatory framework
Headings, orders, odour-related requirements, contacts and on-call arrangements.
What you do not declare
No emission rate, no concentration, no process parameter, no production data. The profile describes where, what and when, never how much. An operator does not have to hand over sensitive data for the system to work, and the platform has no reason to hold it.
Diagnosis
What was running on your site, cross-checked with what residents perceived.
This is the feature that sets an operator account apart from read-only access, and it serves one purpose: knowing what to act on first. It works at three levels of effort; start with the first, which needs no daily input.
Typical weekentered once, no daily effort
Your usual rhythm: operating days and hours, periods of the most odorous operations, annual closure. A calendar of exceptions flags technical shutdowns and special days, in one line.
Already enough to produce the most useful output: the time slots where reports are systematically concentrated.
File importspreadsheet, weekly or monthly
A file from your own tools: operating schedule, operations log, supervision export, maintenance tracking. Minimal format: one line per event, four mandatory columns.
No change of habit: you import what your teams already produce.
One-off declaration30 seconds, on mobile
For what appears in no file: a delayed unloading, a bypass, an incident, unplanned maintenance. Declared from the field as it happens.
A declaration made on the day has a value that the same information, reconstructed a month later, no longer has.
What you get from it
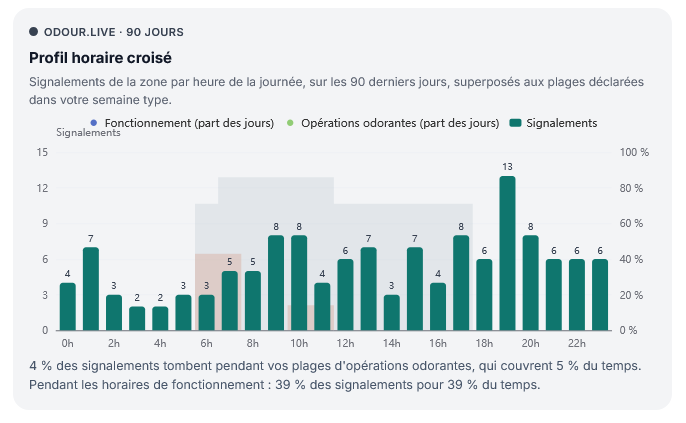
Cross-checked hourly profile
Hourly distribution of reports set against your operating periods. It often leads to a schedule shift that costs nothing.
Overlaid timeline
Reports, operating events and wind direction on the same time axis: the reading that speaks in a meeting.
Signature by source
Odour family and wind pattern, source by source. Points to the equipment or operation to deal with.
Effect of measures
Before and after comparison of each dated action, over an equivalent period.
Back-trajectories: an occasional tool, for multi-source situations
In an area where several installations have similar activities, or where a diffuse source overlaps with a point source, tracing trajectories back from reports and wind conditions helps point the diagnosis to the right equipment. The typical example: telling apart the permanent background of a wastewater treatment plant from a faulty pumping station at the other end of the street.
It is a technical discrimination tool, used occasionally for an episode or a campaign, not a routine feature, and not an attribution instrument. It indicates a plausible area of origin, to be confirmed in the field.
A measure targeted at the right source costs less than a broad measure across the whole site.
Complaints register
The register you must keep, kept for you.
Many prefectoral orders and several sector-specific ministerial orders require a register of odour complaints, sometimes with a monitoring plan. In practice it is often an incomplete spreadsheet picked up in a hurry. Here, it is fed continuously and exported in one click.
All channels in one place
Platform reports, calls, e-mails, complaints passed on by the town hall. Manual entry or a dedicated mailbox.
Follow-up for each entry
Finding, cause identified where applicable, measure taken, person in charge, date: the column missing everywhere.
Export ready to hand over
Paginated, time-stamped document, continuous over the requested period, produced in seconds.
History preserved
Your past registers can be imported. An old entry, even incomplete, keeps its date.
What is looked at is not the absence of odour, it is the approach
No monitoring system makes an odour nuisance disappear or exempts you from a requirement. What can be shown is that an approach exists: reports received, examined, compared with operating conditions, and followed by dated decisions. That trail is what you present, never the absence of complaints. The platform gives you what you need to keep the register required by your order; only the operator answers for compliance.
General information, not legal advice.
Responsiveness
Step in during the episode, not explain it three weeks later.
You set your alert thresholds: number of reports over a period, average intensity, concentration in a downwind sector. When one is crossed, your on-call team is alerted immediately, and can check on site while the odour is still there.
Alert thresholds you set
By source, by time slot, by intensity level. Adapted to your site and its surroundings.
To your on-call team
E-mail, message, or integration with your duty tool, depending on your organisation.
Act while it is useful
Suspend an operation, delay an unloading, check an air treatment unit, go and see on site.
Traceability of your response
The alert, the time it was acknowledged, the action taken and its author are recorded.
Transparency
A technical shutdown announced the day before is better than an explanation three weeks later.
Most odour conflicts feed on silence. A resident who does not know that an annual cleaning is under way, or that a biofilter is being replaced, concludes that nothing is done and nothing will be. The investments you make only exist for the neighbourhood if they are told.
Advance notice
Works, cleaning, technical shutdown, exceptional operation. Visible to residents in the perimeter before the odour arrives.
Update on an episode
What was found, what was done, the time to return to normal. Published on the area, time-stamped.
Progress on your commitments
Actions announced in committee, with their deadline and status. Viewable between two meetings.
One message, for everyone
Municipality, residents' group and residents receive the same information, at the same time, in the same words.
Operator space
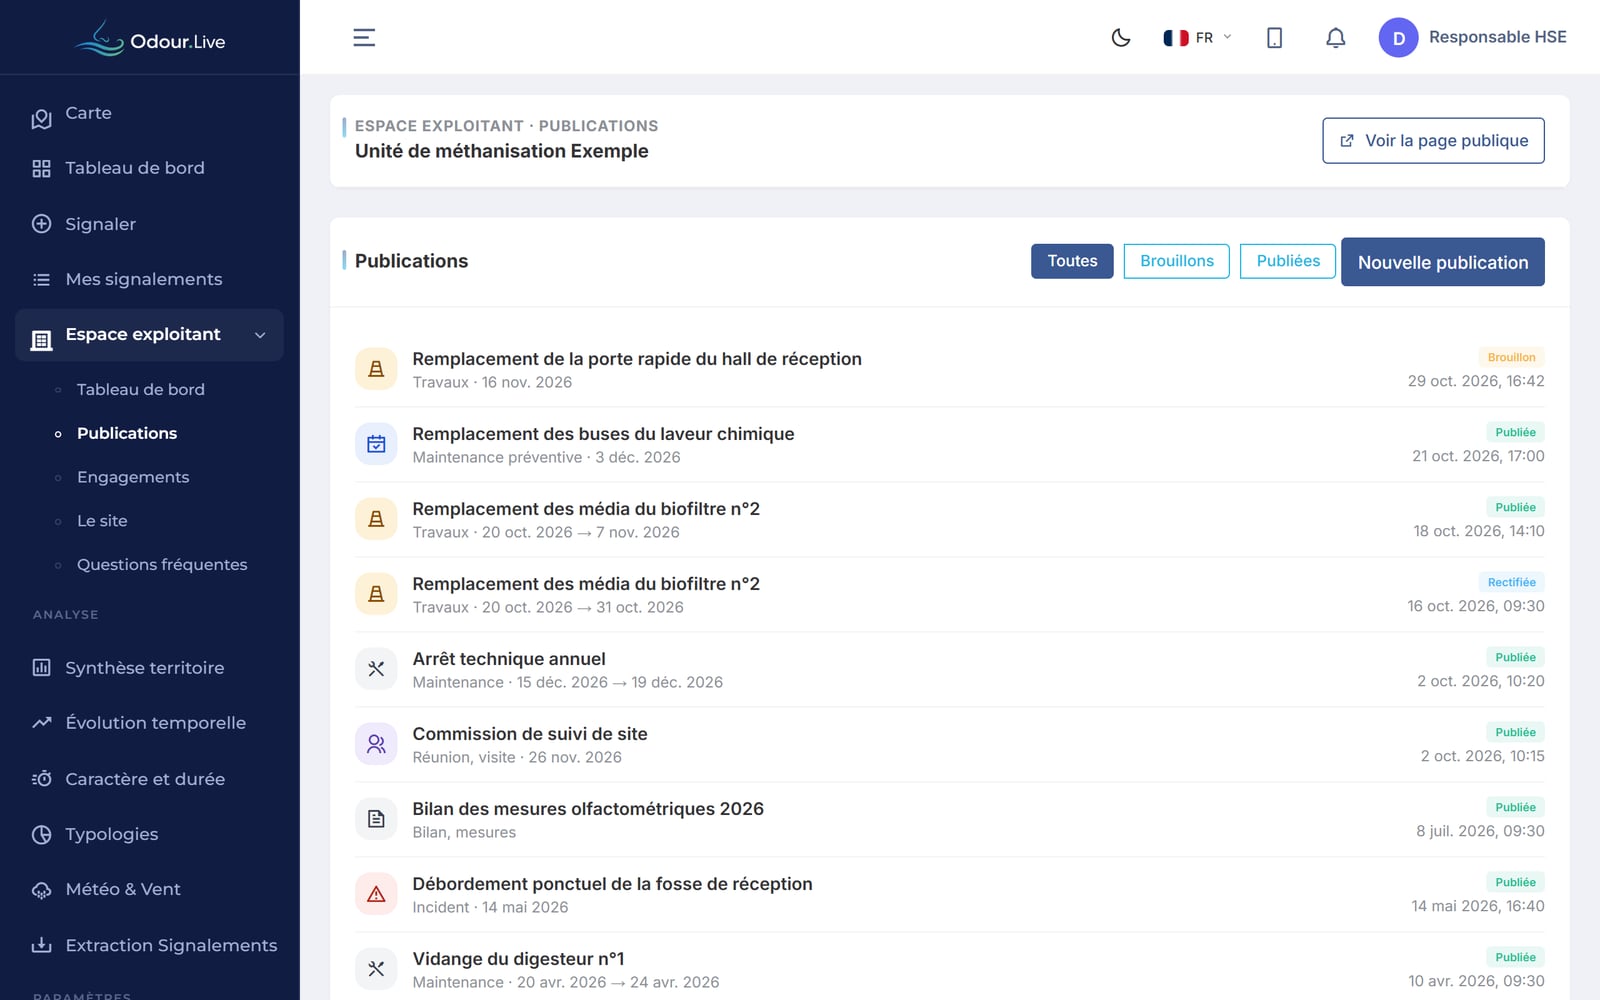
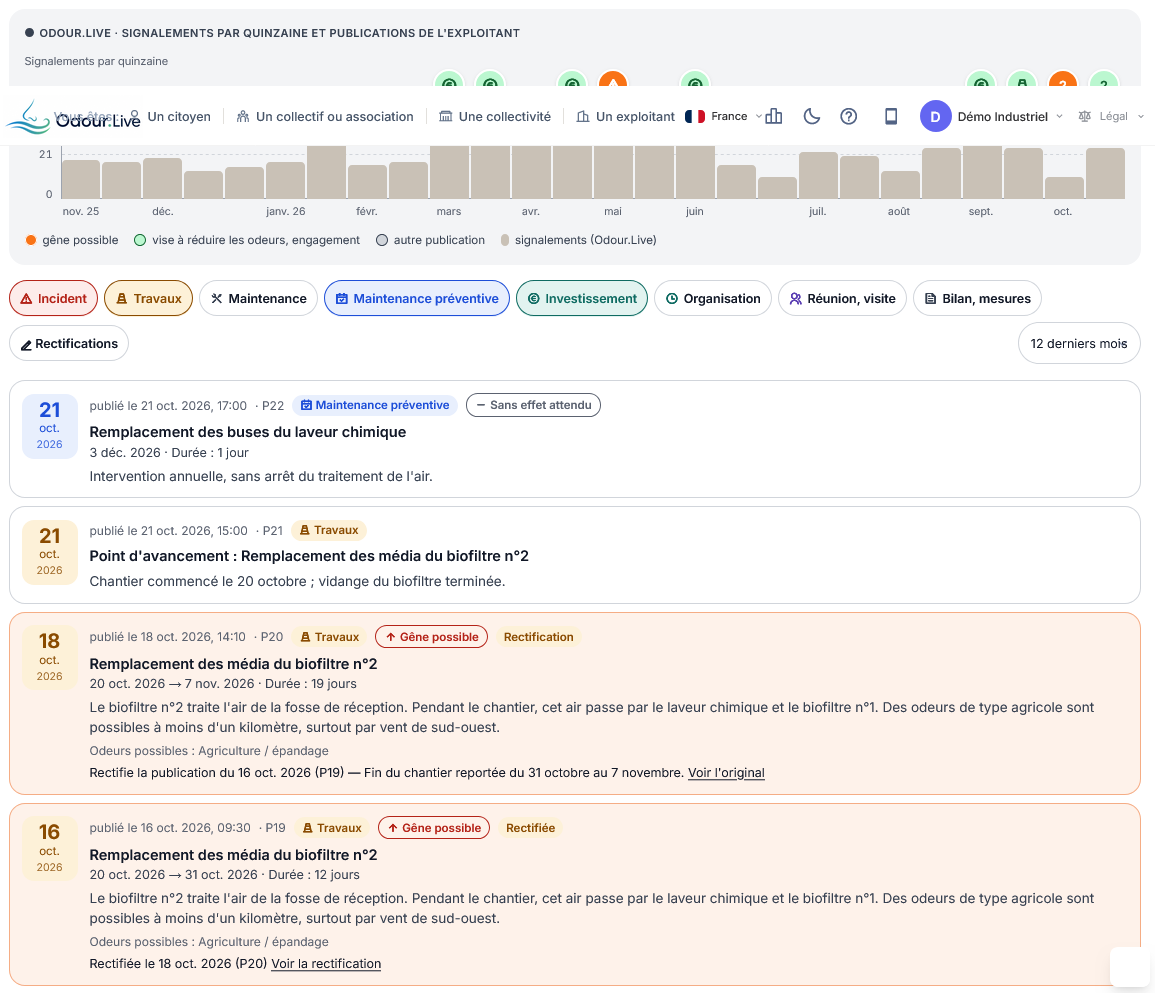
The publication log
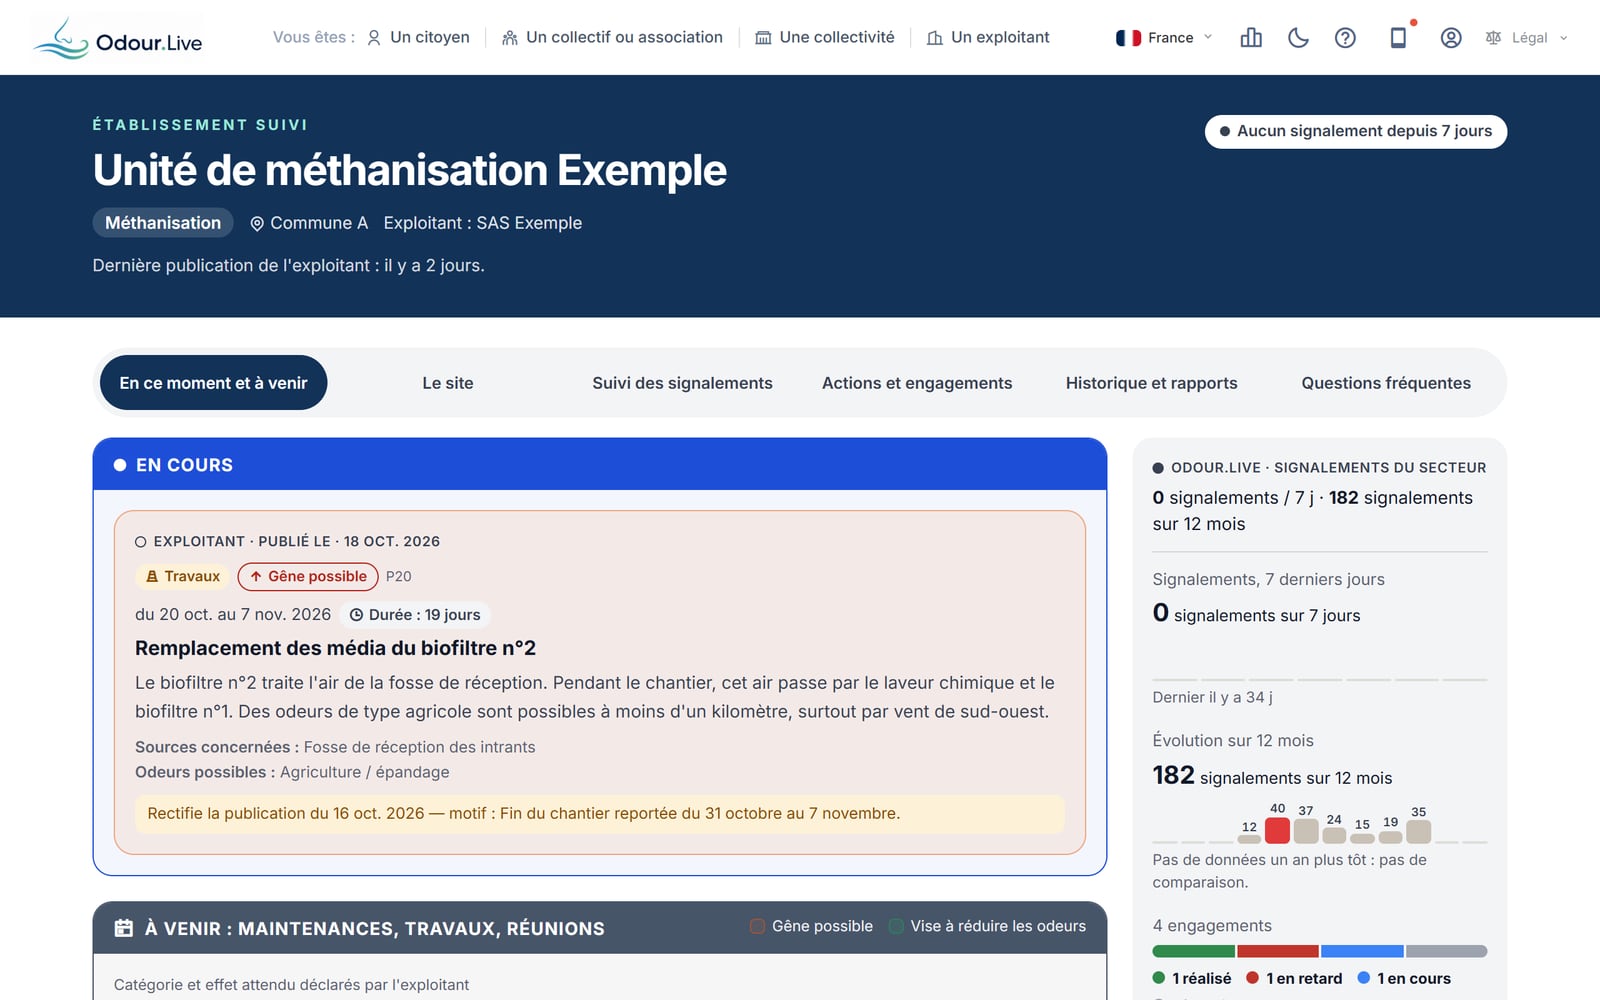
Works, maintenance, meetings, incidents: each publication is dated, numbered and final; a correction takes the form of a visible rectification.
What is announced stays available, with its date.
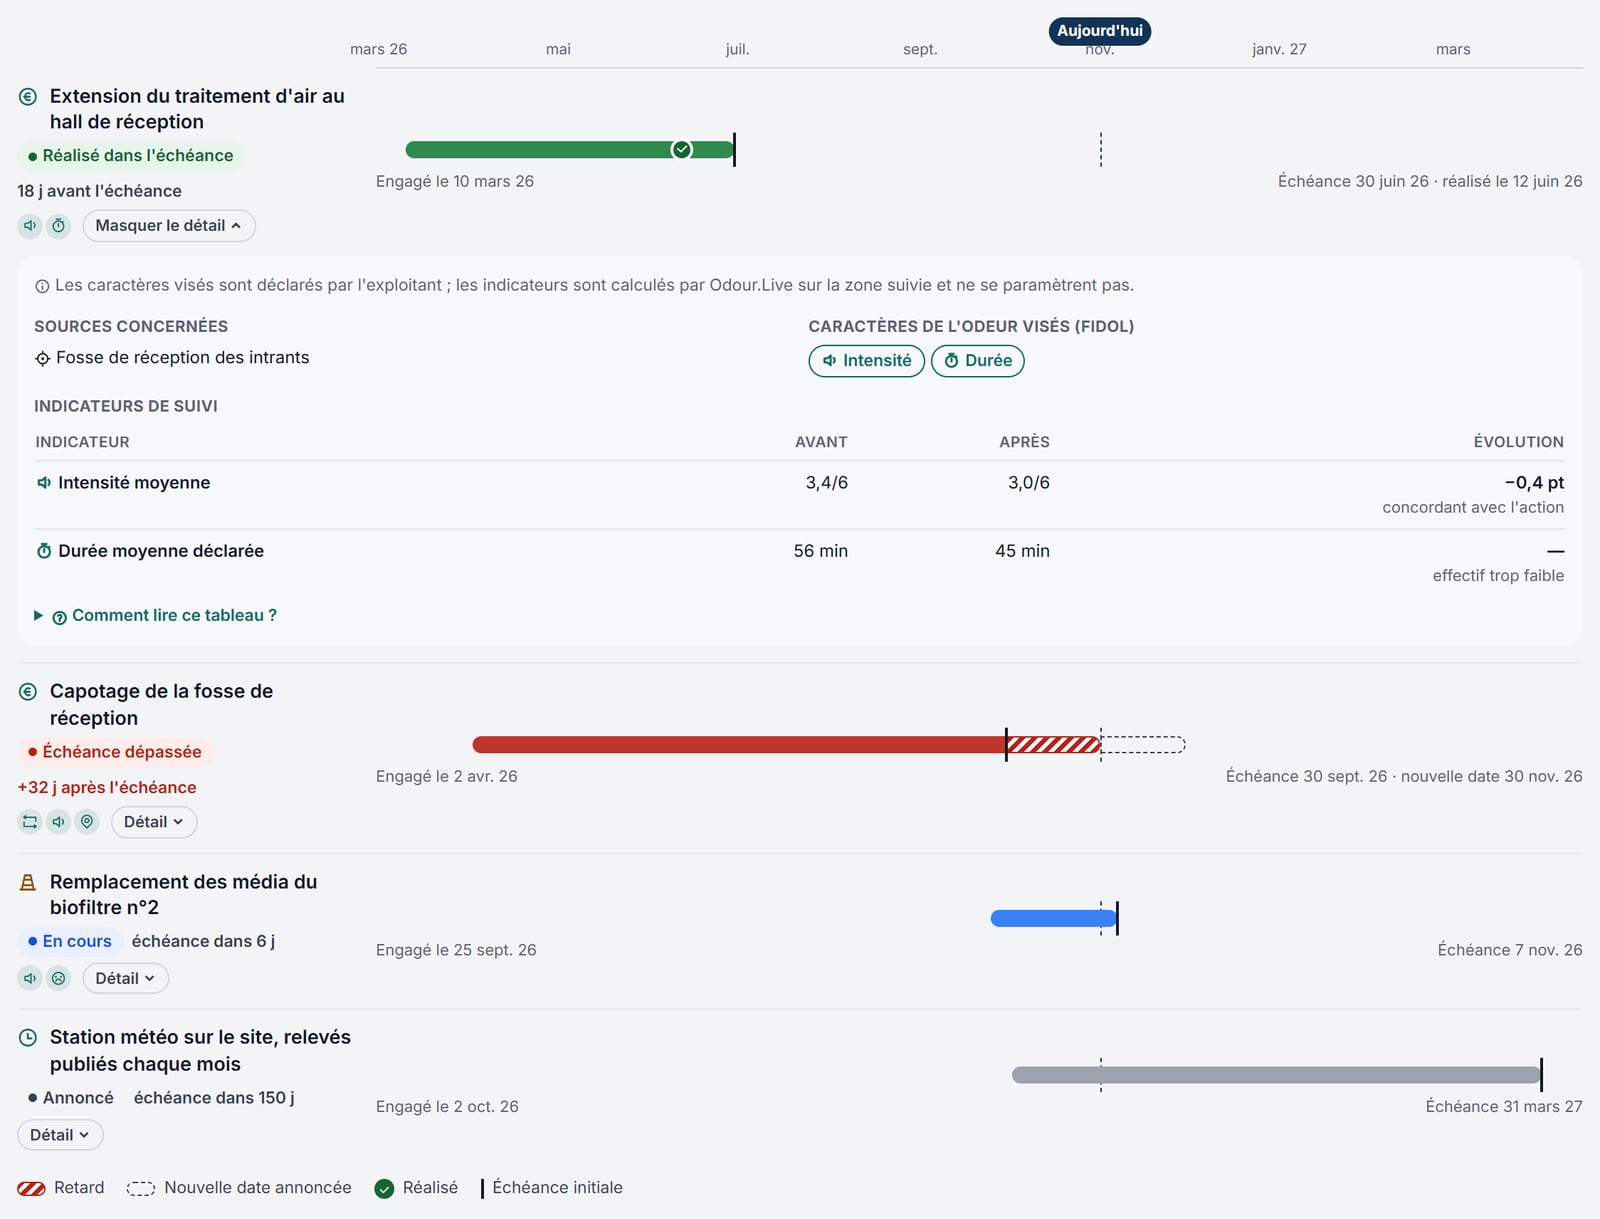
Public page
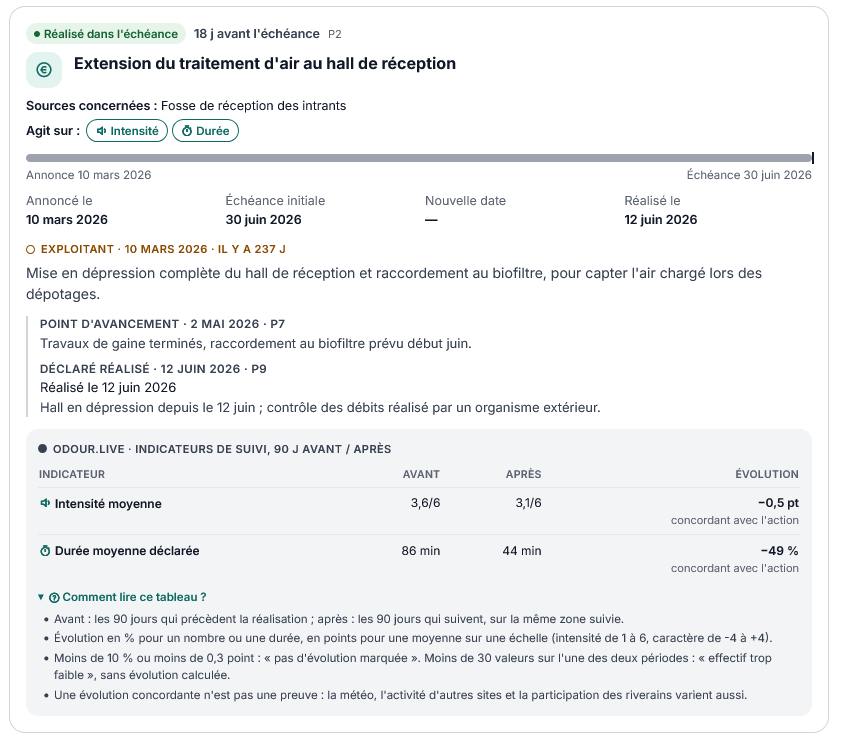
Commitments and their progress
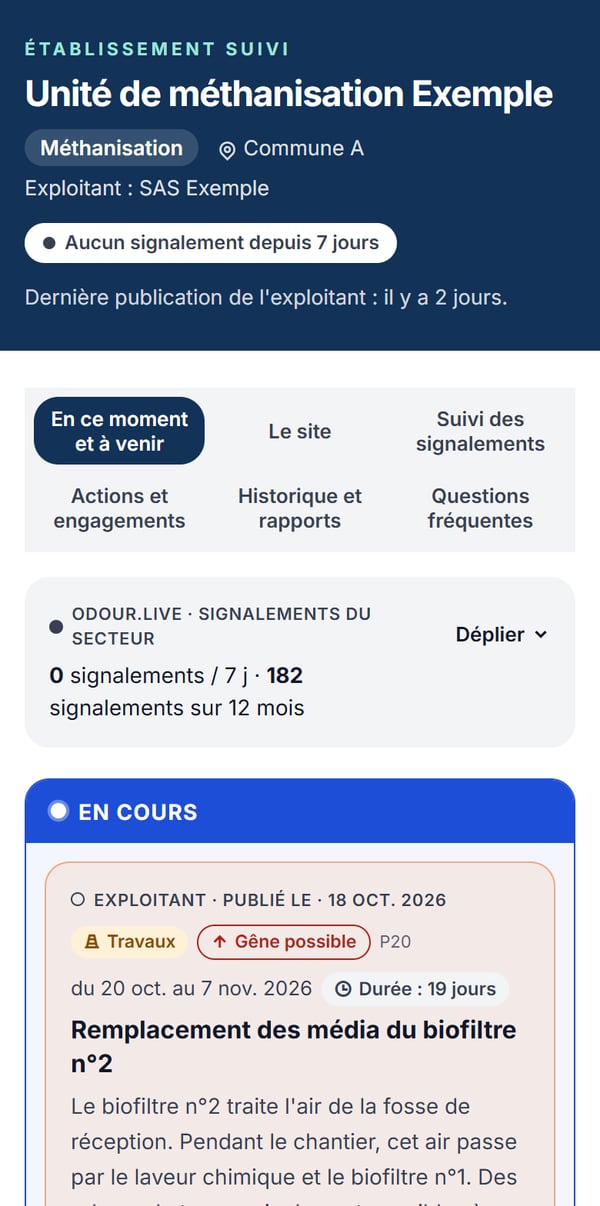
Fixed initial deadline, visible delay or new date, odour characteristics targeted (icons) and, in the details, the effect measured by Odour.Live before and after completion.
Progress can be read between two committee meetings, by everyone.
Screenshots of a demonstration page: site name, municipality and operator anonymised.
What this module does not allow, and never will
You publish on an area, never in response to a report. No individual reply, no comment under a report, no way to dispute a perception. A resident must never feel that their report triggers a reaction aimed at them.
You have access to no identity and contact no one. The platform passes on no name, address or contact details, and will not do so for payment either.
Your publications are time-stamped and cannot be deleted, exactly like reports. A published announcement commits you, and that is what gives it value.
Trust is not built on the day you need it.
Review and indicators
One hour a month, always the same questions.
The report produces itself. What has value is the routine: a regular review, in a constant format, that leaves a dated record of what was found and what was decided. The same figures then serve management, the site monitoring committee, residents and the classified installations inspectorate.
Volume and trend
Reports over the period, change, number of distinct contributors.
Severity
Distribution of intensities on the VDI 3882 scale, share above “strong”.
Orientation
Odour family cross-checked with wind direction, source by source.
Site responsiveness
Average time between the alert and the action taken.
Effect of measures
Before and after each dated action: what turns an investment into a result.
Commitments kept
Share of announced actions completed by the announced deadline.
A few analyses already available on the platform, and those specific to operators:
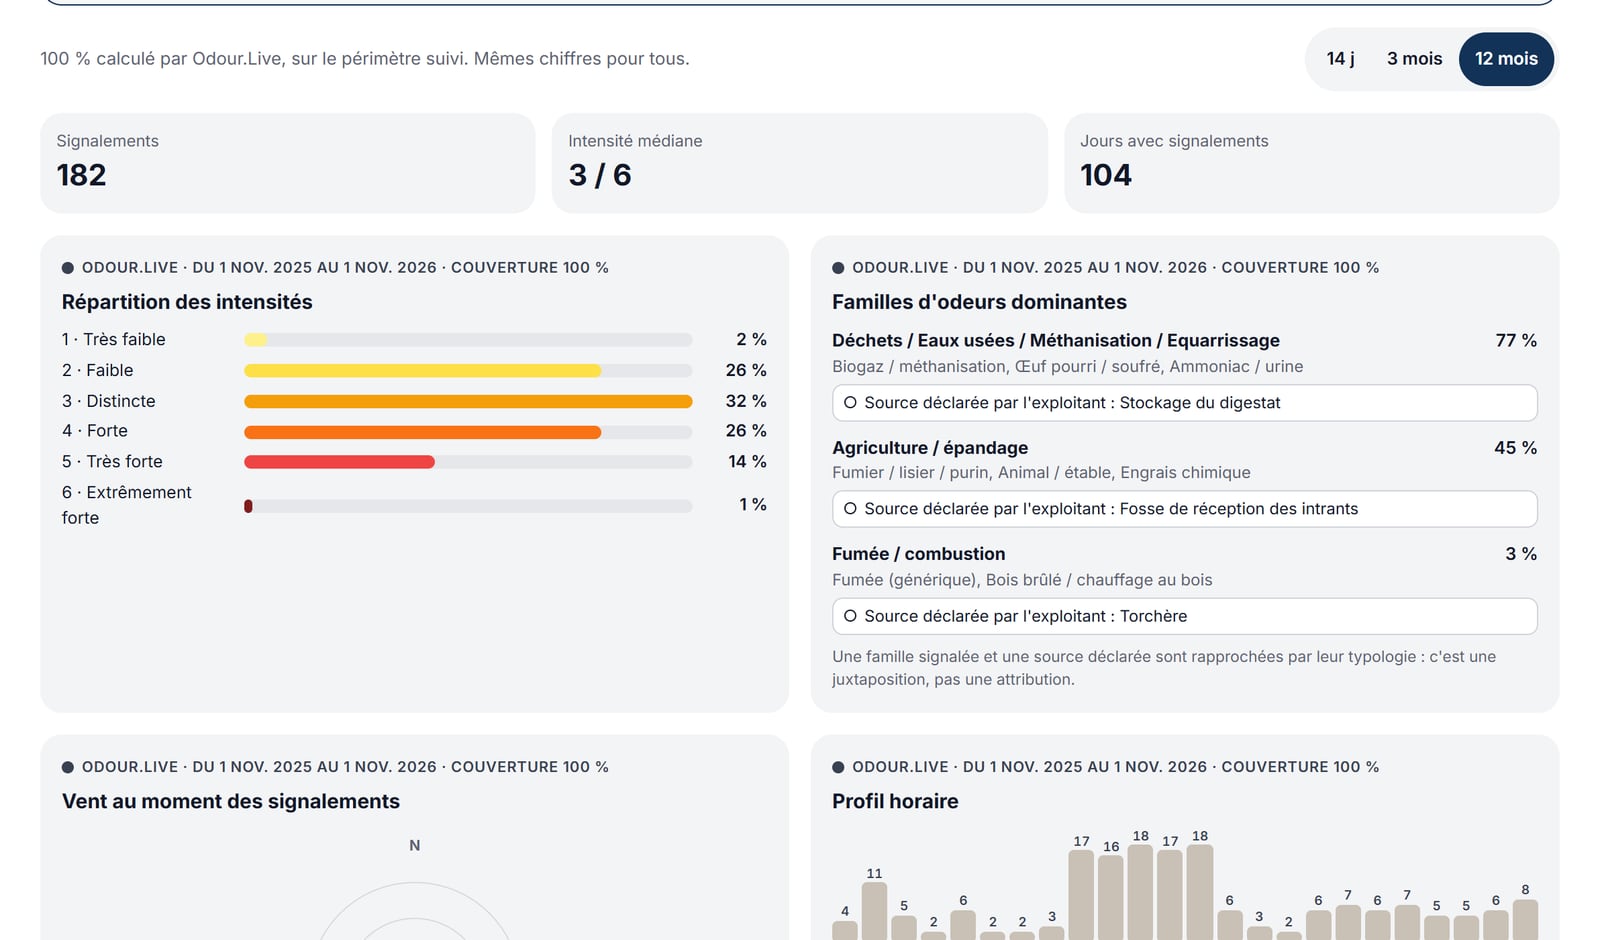
Public page
Monitoring of reports in the area
Volume, intensity, odour families matched with declared sources, wind and hourly profile, over 14 days, 3 months or 12 months.
The same figures for the operator, the residents' group and the municipality.
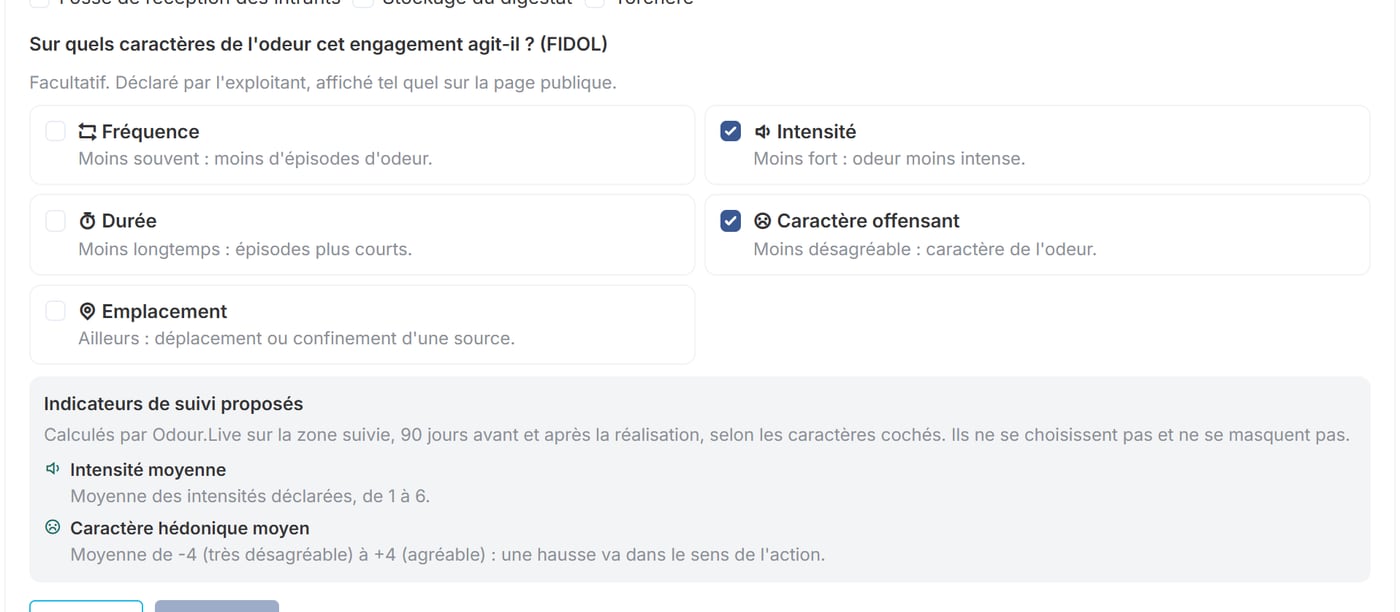
Operator space
An indicator suited to each commitment
The operator states which odour characteristics its action targets (frequency, intensity, duration, offensiveness, location); Odour.Live proposes the indicator that will measure its effect.
Measure intensity when you treat intensity, not just count.
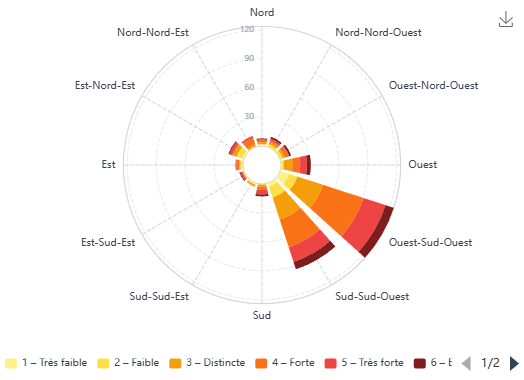
Existing analysis
Wind rose of reports
Distribution of reports by wind direction at the time of observation.
Points to the most frequent sector of origin.
Operator analysis
Overlaid timeline
Reports, declared operating events and wind direction on the same axis, over two weeks.
The central visual: it explains the offer in three seconds.
Operator analysis
Cross-checked hourly profile
Hourly distribution of reports overlaid on the declared operating periods.
“Shift this operation by two hours”: the decision that costs nothing.
Operator analysis
Before and after a measure
Eighteen-month time series, with a dated marker when a system is commissioned.
The measured effect of an investment on the nuisance perceived.
Method
A method you can examine before accepting it.
Your first reflex will be to question the data. That is legitimate, which is why the method is published in full, with its limits, before you have an account. The reference frameworks are those of environmental agencies and odour standardisation: the ones your consultancy already cites.
FIDOL factors
Frequency, intensity, duration, offensiveness, location: the grid used by environmental authorities.
VDI 3882 scales
Intensity and hedonic tone on standard scales, stable from one person and one year to the next.
Weather recorded at source
Wind, gusts and temperature at the time of the report, not reconstructed afterwards.
Abnormal series flagged
Inconsistent series are flagged. None is deleted, neither on our initiative nor on yours.
What the platform is not, and why it is complementary
Odour.Live does not measure an odour concentration: no dynamic olfactometry, no standardised observation by a panel. It documents residents' perception, continuously and over time.
Your campaigns characterise an emission a few days a year; the platform documents perception every day of the year, nights and weekends included, which is when most episodes occur. The two approaches complement each other and neither replaces the other.
Read the full method
Reference frameworks, scales, weather source, privacy and known limits.
Position
You pay for the tool. You do not buy the data.
This is the section that residents, elected officials and journalists who come across this page will read first. It is written for them as much as for you, and it is what gives your subscription its value: a system you could influence would be worthless the day you present it in committee.
No rights over content
No deleting, editing, hiding or delaying a report. No disputing it before publication. No paid option will allow it.
No access to people
Degraded position, identity never passed on. You will not know who reported, and you will not be able to contact anyone.
No head start on information
You see reports at the same time as the residents' group and the municipality. Not a minute earlier.
Reciprocity
What you publish about your operations can be read by residents in the perimeter. It is the counterpart of the analysis you get, and the most direct way to show what you do.
Our business model, plainly
Professional access is paid; access for residents, residents' groups, associations and local authorities is not, and never will be. What you pay for is the tool: visualisation, alerts, matching, the register, reports.
On the reports, you see neither more, nor better, nor sooner than the residents' group in your area. What you add is your own operating data, and what you publish from it is made visible to them.
The subscription is annual, per site, adjusted to the size of the installation and the extent of the monitored perimeter. It is never indexed on the number of reports: volume-based pricing would create, on the wrong side of the table, an interest in there being fewer. We would rather say so than leave it to be guessed.
A system you could influence would be worthless the day you use it to show your progress.
Costs
These items are already in your budget. Just scattered.
The amounts below are orders of magnitude, for a medium-sized site receiving sixty to one hundred reports a year and holding an annual site monitoring committee. They do not apply to your site: they give the structure of the calculation, which we fill in with your own volumes during the meeting.
| Item | Today | With continuous monitoring | Annual difference |
|---|---|---|---|
| Internal handling of reports80 complaints, 1 h 30 → 20 min | 6,600 € | 1,450 € | − 5,150 € |
| External consultant to handle reports4 d → 1.5 d focused on diagnosis, €750 / d | 3,000 € | 1,125 € | − 1,875 € |
| Replies to letters and requests10 letters, 4 h → 1 h | 2,200 € | 550 € | − 1,650 € |
| Preparing the site monitoring committee3 d → 0.5 d | 1,155 € | 195 € | − 960 € |
| Rebuilding the register before inspection2 d → export | 770 € | 0 € | − 770 € |
| Scoping field campaign€10,000 every 2 years, refocused, not removed | 5,000 € | 3,000 € | − 2,000 € |
| Total recurring per year | 18,725 € | 6,320 € | − 12,405 € |
Assumptions: loaded internal hourly cost 55 €, 7-hour internal working day, 80 reports and complaints per year across all channels, 10 formal letters or requests per year, one annual site monitoring committee, a field campaign of 10,000 € every two years. External consultant at 750 € excl. VAT per day, 4 days per year, reduced to 1.5 days focused on analysis. The subscription is not included in the table: the comparison is yours to make.
Integrated approach versus reactive approach
The items above are recurring and predictable. Those not in the table are not: responding to a referral, handling an appeal, meeting an imposed timetable, delaying an extension file by several months. These costs arrive all at once, at a time you do not choose, and the spending produces nothing but a response.
Continuous monitoring spreads the same spending and turns it into a reusable diagnosis, which then serves to target investments, justify them and measure their effect.
Projects and acceptability
Four moments when the track record changes the outcome
General information, not legal advice.
Getting started
Up and running before the next committee.
Demonstration on your actual situation1 hour
Not a generic presentation: the map of your area, any reports already filed, and the cost grid filled in with your own volumes.
Agreement and perimeterto be prepared
Monitored perimeter, named access, duration, mutual commitments. The document is sent in advance to your legal department.
Site profile workshophalf a day, assisted
Sources, odour families, treatment systems, typical week. Done once, with your operating teams.
First monthly review1 hour, after 30 days
Run with you the first time. After that, it runs on its own.
How it is billed, and why
Annual subscription per site, adjusted to the size of the installation and the extent of the monitored perimeter. Never indexed on the number of reports. The amount depends on the perimeter: it is set after the demonstration, not before.